Modeling and Forecasting Stock Market Volatility of CPEC Founding Countries: Using Nonlinear Time Series and Machine Learning Models
Abstract
The highly sensitive, nonlinear, and unpredictable stock market behaviours are always challenging for researchers. Stock markets of Pakistan and China, i.e., KSE-100 and SSE-100, respectively, are the two most attractive stock markets after the official announcement of CPEC. Thus, the daily closing price of KSE-100 and SSE-100 Stock returns are used to evaluate the volatility forecast performance of the machine learning technique, GARCH family and the nonlinear regime-switching models. The findings of this study revealed that the standard GARCH model is the best-fitted model based on Akaike’s Information Criteria (AIC) and Bayesian Information Criteria (BIC). Furthermore, the forecast performance of the machine learning LSTM model outperforms other models based on RMSE for SSE-100. In contrast, the forecast performance of CGARCH for SSE-100 and the Markov-regime-switching model for KSE-100 outperforms other models based on MAE, MAPE, and SMAPE evaluation criteria. It is also revealed that the predictive power of the machine learning model is very close to CGARCH and MRS model; therefore, the LSTM model can be used as an alternative to GARCH and regime-switching models for stock market volatility. These findings will help national and international investors, policy-makers, geographical economists, and industrialists to use the best forecast model to make better policies and gain tremendous profit.
Keywords
forecast comparison, machine learning, LSTM, CGARCH, CPEC
INTRODUCTION
China Pakistan economic corridor (CPEC) is one of the best projects of one belt one road, i.e., OBOR. OBOR is an economic strategy by China and Pakistan to connect nations from Asia to Europe.Azad and Serletis (2022) studied the stock market behaviour and its impact on macroeconomic indicators. They revealed that the positive shocks on stock markets lead to increased consumption by improved wealth effect, investment by boosting investors’ confidence, and short-run GDP. They also showed that the stock markets are positively associated with the countries’ GDP. Many researchers (Ball & French, 2021; Beck & Levine, 2004; Demirgüç-Kunt & Levine, 1996; Harris, 1997; Levine & Zervos, 1998; Levine, 1997) found a weak correlation between the stock market returns with other macro and micro economic indicators. Ball et al. (2021) also observed that the rise in the movements of a stock market is directly proportional to investors wealth. It is necessary to highlight the importance of stock markets related to CPEC for high national and international investment. These stock markets can play a vital role in the future in improving economic growth and reducing the inflation of many linked countries, especially developing countries, i.e., Pakistan, China, Turkey, and Iran. The strong bonding of stock markets from different countries always positively impacts investors, risk actuaries, and economists, increasing corporations’ earnings and sales and boosting economic growth. These stock markets can also play a vital role in engaging more countries to become part of CPEC like G-7, G-8, G10, G-20, BRICS, and BEM countries.
Various authors (Butt & Butt, 2015; Hadi, Batool, & Mustafa, 2018; Hussain & Hussain, 2017; Kanwal et al., 2019) studied the CPEC impacts geographically and geopolitically. CPEC, also known as “The Game Changer,” is heavily needed for risk analysis; therefore, economists, investors, and policy-makers are working to find the appropriate and suitable methodologies to understand and capture the stock market behaviour. Also, they can use these methodologies to forecast the volatility behaviour, especially in the events that cause heavy consequences, i.e., the COVID-19 pandemic. Unfortunately, the modeling and forecasting of stock market volatility is not the attention of CPEC founders. The economic growth of a country mostly depends on the role of the financial markets. The stock markets play a key role in promoting the security between the investors and dealers. Therefore, the estimation and prediction of Stock market volatility are always attractive for the decision-makers. The literature shows that the modeling and forecasting of stock volatility gained much attention from researchers, economists, and investors in assessing the investment risk due to its nonlinear and noisy behaviour. Many time series and econometrics models are used for this purpose.Engle (1982) proposed the Autoregressive conditional heteroskedasticity (ARCH) model to estimate the conditional variance.Bollerslev (1986) extended the ARCH model and introduced the generalised autoregressive conditional heteroscedasticity (GARCH) model that allows the conditional variance to depend on the past lag values. The importance of volatility modelling increased drastically due to the stock market financial crash in 1987. After that, (Nelson, 1991) introduced exponential GARCH (EGARCH) to capture the leverage effect. The extension of GARCH models included the GJR-GARCH model by (Glosten, Jagannathan, & Runkle, 1993), the Power ARCH model by (Schwert, 1990).Engle and Lee (1999) also introduced the component GARCH (CGARCH) model that captures transitory effects and slower variations, i.e., permanent and transitory components.
Meanwhile,Hamilton (1989) proposed a nonlinear regime-switching model that allows the variance of the stock market returns to shift across states, i.e., different volatility regimes, namely the Markov regime-switching (MRS) model. MRS model can provide plausible for empirical estimation and forecasting of the volatility of stock market returns. Various authors (Bialkowski, 2004; Chkili & Nguyen, 2011; Fraz, Iqbal, & Uddin, 2020; Linne, 2002; Wang & Theobald, 2008), used the Markov-regime switching model for different financial and economic indicators, stock indices and share markets from emerging, developing, and developed countries. Recently, Machine learning models have been famous for most time-series data. These machine learning models are well-known for forecasting the time series data without considering the much information of the parameters. ML long-short term memory (LSTM) model depends on the recurrent neural network (RNN) and can classify and forecast the time series data by using the unknown lags of important events, i.e., CPEC signing and Covid-19 pandemic, etc. Recently several researchers (Chen, Zhou, & Dai, 2015; Nelson, Pereira, & Oliveira, 2017; Shah, Campbell, & Zulkernine, 2018; Sunny, Maswood, & Alharbi, 2020; Yao, Luo, & Peng, 2018) studied stock market volatility based on the machine learning LSTM model. Their findings are based on different forecast evaluation criteria.
This study evaluates the estimation and forecasting of volatility for the two stock markets from CPEC: the Karachi stock exchange (KSE-100) in Pakistan and the Shanghai stock exchange (SSE-100) in China. The daily data covers the period from April 2015, i.e., after the CPEC agreements were signed (20 April 2015 to June 2021). These empirical evaluations were demonstrated through three well-known forecast techniques, i.e., traditional volatility models, i.e., GARCH family models, GARCH and component (CGARCH) models, nonlinear threshold Markov-regime switching model (MRS) and machine learning LSTM model. Daily stock market returns of CPEC founders, i.e., KSE-100 and SSE-100, are used in this study. Selection of frequency of data is due to official signings for CPEC from Pakistan and China nations while it ends till June 2021 to cover the Covid-19 pandemic. This study contributes to the literature by filling the gap in the forecast comparison of the machine learning model with the standard GARCH and CGARCH models. Also, there is no research in previous literature in which the stock markets of CPEC founders are studied concerning model fitting and forecasting comparison of CGARCH and LSTM models related to stock market volatility.
LITERATURE REVIEW
It is found from the vast literature that the well-known ARCH and GARCH models are the most prominent and used techniques to capture the no linear behaviour of the financial time series (Gabriel, 2012). Numerous researches (Alberg, Shalit, & Yosef, 2008; Chen, Härdle, & Jeong, 2010; Franses & Dijk, 1996; Gokcan, 2000) are present in the literature on estimating volatility through GARCH models. Still, there are rare current studies in which GARCH and regime-switching models are used to estimate the volatility of stock markets, especially for CPEC founders after 2015. Furthermore, there is no study in which the forecast performance of the machine learning LSTM model is compared with the traditional standard GARCH, CGARCH and nonlinear regime-switching (MRS) models. Recently,Naik and Mohan (2021) compared the GARCH model with the nonlinear self-exciting autoregressive (SETAR) model to capture the volatility of Nifty-50 share stocks, namely Tata Steel, Bharti Airtel, HCL TECH and NTPC (National Thermal Power Corporation) and stock indices, i.e., Nifty-100, Nifty-50 etc. from January 2007 to April 2021. They found that no individual time series model can capture the share market. They combined the Markov-regime switching and GARCH model (MS-GARCH) to forecast the share markets. According to their findings, the forecast performance of the MS-GARCH model is better than the nonlinear time series SETAR model and traditional GARCH model. Their results are based on RMSE and MAPE.
Zou and Qu (2020) also compared the forecast performance of the LSTM model. They used the standard LSTM model, Staked LSTM model and attention-based LSTM model. They also compared the forecasts from all LSTM models with the traditional Box-Jenkins approach (Newbold, 1975), i.e. auto-regressive integrated moving average (ARIMA) model. They used daily data of S&P-500 from 2004 to 2013. The data included volumes and prices of S&P-500. Also, the added statistics related to the corporate and accounting of S&p-500 from 2004 to 2013. They found that the forecast performance of LSTM models is better than the ARIMA model. They also revealed that the attention-based LSTM model outperforms the standard LSTM and stacked LSTM model based on the mean square error (MSE). Devi (2018) employed GARCH models to evaluate the forecast performance using the New York stock exchange (NYSE) of the USA and (FTSE) of the UK from January 1991 to December 2014 (monthly). She found that the EGARCH model outperforms other GARCH models based on RMSE. Moreover, her findings revealed that GARCH models are more suitable for NYSE than FTSE.Mubarik and Javid (2016) evaluated the forecast performance of GARCH, EGARCH, GARCH in mean (GARCH-M), GJR-GARCH, threshold ARCH (TARCH), and PARCH. They used KSE-100 stock market returns from July 1998 to June 2011. They evaluate the forecast performance of all GARCH models by different statistical distributions. They revealed that all GARCH models are suitable. Still, those measured through student-t distribution are more reliable than other distributions included in the study based on three evaluation criteria, namely RMSE, MAE, and MAPE. (Ahmad, Ahmed, Vveinhardt, & Streimikiene, 2016) studied the daily data of Asian stock markets from January 2002 to December 2009. They used GARCH (1,1) model to estimate the volatility of the KSE-100 in Pakistan, Bombay stock exchange of India (BSE Sensex), NIKKEI-225 in Tokyo stock exchange (Japan), SSE-100 in China, Korea composite stock price index (KOSPI) of South Korea and Hang Seng of Hong Kong stock markets.
Subsequently,Cheteni (2016) also studied the stock markets of South Africa and China from January 1998 to October 2014. He used monthly data to estimate the GARCH (1,1) model. He found high volatility in the Johannesburg stock exchange and SSE-100. He also revealed that both stock market returns follow the same trajectory movements.Moore and Wang (2007) used the nonlinear regime-switching model, namely the Markov Regime-Switching (MRS) technique, to estimate the volatility of the weekly closing prices from 1994 to 2006 in stock markets of the Czech Republic, Hungary, Poland, Slovenia, and Slovakia. They found that the MRS model is reliable for modelling volatility in regimes.
Jammazi and Nguyen (2015) studied the effect of monthly oil price surges, i.e., WTI and Brent oil prices, on the five developed stock markets cycles, namely Canada, Japan, Germany, USA, and the UK from January 1989 to December 2007. They proposed an enhanced nonlinear technique to investigate the association between stock market volatility and oil prices. They revealed that the stock market’s volatility is regime-dependent, but oil price shocks are not regime-dependent based on the MRS model.Chevallier and Goutte (2015) explored daily stock returns from June 2004 to July 2014 using seven stock markets, namely Euro STOXX-600, DJIA, Global Dow, Russel 2000, Nikkei, FTSE, and NASDAQ. They concluded that the MRS model is an appropriate nonlinear technique for regulating the noisy and nonlinear behaviour with regime detection.
Zhang and Zhang (2015) investigated the MSR model’s regime movements of WTI and Brent oil prices. They found the MRS model the best technique to model Oil prices in different regimes. Recently, (Fraz et al., 2020) also compared the forecast performance of the nonlinear threshold models, namely SETAR and Markov-regime switching (MRS) model, with linear AR models, for quarterly data from 1970 to 2016 of gross domestic product (GDP), exchange rate, and inflation from G-7 countries namely Canada, Germany, France, the United Kingdom (UK), Italy, the United States (US) and Japan. They also used the same indicators from Pakistan as well. They found that the SETAR and MRS models are suitable forecast models for selected nonlinear time series financial data included in the study. Also, they revealed that the forecasting power of linear AR is reliable in a few cases. Their findings are based on RMSE, MAE and MAPE forecast evaluation criteria.
Chen et al. (2015) studied the historical data from China stock market. They used the machine learning LSTM model for estimation and forecasting. According to their findings, the prediction power of the LSTM model is more reliable and accurate than random forecasting methods. Furthermore, the LSTM model raised the accuracy by approximately 27%.Runfang, Jiangze, and Xiaotao (2017) studied the monthly price data of WTI oil market volatility from January 1986 to May 2017. They compared the forecast performance of the GARCH and EGARCH models. They found that the forecast performance of the EGARCH model is better than the GARCH model based on RMSE. Furthermore, they used the MRS-GARCH model to forecast the oil price volatility and concluded that the MRS-GARCH model outperforms the EGARCH model based on RMSE forecast criteria. Subsequently,Shah et al. (2018) compared the forecast performance of two machine learning models: LSTM and deep neural network (DNN). They used daily and weekly stock market returns of BSE SENSEX. They found the LSTM model more promising as compared to the DNN model.
Yao et al. (2018) also modeled and compared the machine learning LSTM model with random predictions for the CSI-300 constituent stocks from China in the same year. They found that the LSTM model is suitable for forecasting stock data.Chen and Ge (2019) explored the Hong Kong stock price movements using the machine learning LSTM model and proposed an LSTM hybrid model. From the vast literature, it is found that there is a gap in the model and forecast of the stock market volatility for CPEC founder nations, namely Pakistan and China. This study is an attempt to fill the gap. It will also help economists and investors use a better modeling technique to forecast volatility accurately, especially in rare events, i.e., the Covid-19 pandemic.
METHODOLOGY
This paper uses daily closing prices of stock markets from CPEC founder countries, namely the Karachi stock exchange (KSE-100) of Pakistan and China’s Shanghai stock exchange (SSE-100). The data is taken just before the official signing month of CPEC (April 2015) between Pakistan and China, i.e., from 1 December 2014 to 31 December 2021, excluding the weekends. Data also covered the Covid-19 pandemic period. The data has been taken from investing.com. Firstly, logarithmic transformation is used to calculate the stock returns as according to equation (1):
The ADF unit root test has checked the stationary data based on Schwartz info criteria with and without trend. The ARCH-LM test is used to verify the ARCH effect. After that, the data is split into two parts, i.e., data from 1 December 2014 to 30 April 2021 is used to estimate the models, while the remaining data till 31 December 2021 is used for the out-of-sample forecast evaluation. The best volatility forecast model selection is based on AIC and BIC information criteria. Forecast performance is based on four forecast evaluation criteria, namely Mean Absolute Error (MAE), Mean Absolute Percentage Error (MAPE), Root Mean Square Error (RMSE), and Symmetric Mean Absolute Percentage Error (SMAPE), given by:
Where, ft,s as the forecast made at time t for s steps ahead (i.e. the forecast made for time t+s, and yt+s as the realised value of y at time t+s.
GARCH Model
The ARCH model introduced byEngle (1982) is used widely in financial time series forecasting. The (GARCH) model proposed byBollerslev (1986) is an extension of the ARCH technique and allows supporting changes in the time-dependent volatility. The GARCH (1,1) can be written as follows:
Where is known as conditional variance while is conditional variance, are residuals known as ARCH effect and is constant term.
CGARCH model
The component GARCH model was introduced by Engle et al. (1999). CGARCH is capable to estimate the volatility high persistence of financial time series. Conditional volatility is decomposed into two components i.e. short and long term volatility. CGARCH (1,1) can be defined by using Equation 6:
Here and is short and long term volatility.
Markov Regime switching model
Markov regime switching (MRS) model was firstly introduced by Hamilton (1989). The famous nonlinear time series model involves several equations that characterise the financial time series behaviour in regimes. It follows the first-order Markov chain process. A simple model with two AR specifications can be written as follows:
Here is an unobservable variable. If follows first order Markov chain then:
The transition probability when given that
Machine learning LSTM model
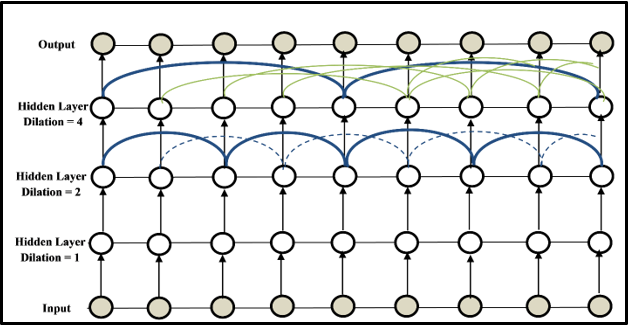
The long short-term memory (LSTM) model is a machine learning that depends on the recurrent neural network (RNN) technique capable of classifying and forecasting the time series data using the unknown lags of important events. The RNN was firstly introduced in the late 1980s (Lindemann, Müller, Vietz, Jazdi, & Weyrich, 2021). The ability to model and forecast the LSTM model for nonlinear financial data is widely explored. To capture difficult densities for time series data, dilated recurrent skip connections are used to extend the RNN technique to make a memory capacity (Figure 2). This study uses 80% of data for training, 10% for validation, and 10% for forecast performance comparison.
RESULTS AND DISCUSSION
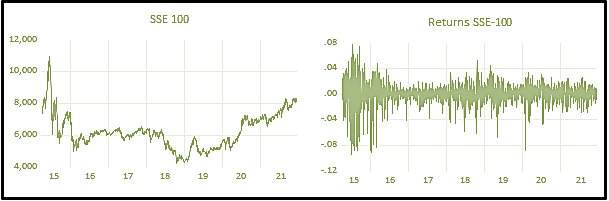
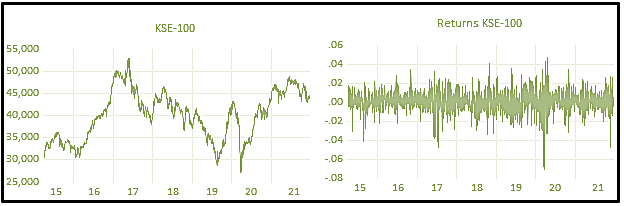
Nonlinear and structural breaks can be seen in the SSE-100 stock market index Figure 3. The stock market tends to decrease from 2016 till the end of 2020. But after 2020, the stock market shows an increasing trend that has continued until now. Similarly, the KSE-100 stock market follows a similar pattern, i.e., structural breaks and nonlinear behaviour Figure 4. But it can be observed from the graph that after mid of 2015, i.e., the signing of CPEC officially, the KSE-100 index increased drastically. It suddenly drops from 2018 to 2019 due to Pakistan’s political issues. The Covid-19 pandemic seems to drop again just after a good comeback after the 2nd quarter of 2019. The nonlinear structure can be captured by nonlinear time series and machine learning models. Also, the stock returns show high and low volatility (after taking 1st difference in time series data). Both stocks’ returns volatility shows depression between 2019 and 2020, i.e., extremely low volatility in the Covid-19 pandemic. The volatility clustering also suggests high fluctuations tend to follow high fluctuations while low fluctuations tend to follow low onesFigure 3 and Figure 4.
Table 1 shows the descriptive statistics for KSE-100 and SSE-100 stock market returns. According to the findings, the KSE-100 and SSE-100 stock market returns are negatively skewed and evidence of a long and flatter left side tail. Moreover, kurtosis of KSE-100 and SSE-100 stock returns shows leptokurtic. The Jarque-Bera test of normality also rejects the null hypothesis at a 1% level of significance. Hence, the stock returns are not normally distributed. This evidence concludes that the CPEC stock markets are efficient but unpredictable. The means of both stock returns are positive, and it shows that the price is increased over a period of time. Since the stock returns are positively skewed, a high probability of earning is expected.
The unit root test results are presented in Table 2. According to the results, both the stock returns KSE-100 and SSE-100 become stationary after taking the first difference based on the ADF unit root test. Both confirm these results with the trend and without trend using Schwartz info criteria.
Akaike information (AIC) and Schwartz information (BIC) criteria are used to select the best time series model. Results fromTable 3 Revealed that the GARCH (1,1) is the best-fitted model among other GARCH (p,q) models. Similarly, the CGARCH (1,1) is best based on AIC and BIC criteria. While for the MRS model, the best MRS model with AR (1) is found to be the best among other MRS models with different autoregressive (AR) values. GARCH (1,1) is the best-fitted model for stock market returns, i.e., KSE-100 and SSE-100, based on AIC and BIC information criteria.
The results of the GARCH (1,1) model for KSE-100 and SSE-100 stock market returns are presented in Table 4. The GARCH parameters are highly significant. Furthermore, the sum of GARCH model parameters (i.e. ARCH and GARCH coefficients) is less than 1 for both the stock returns. According to the findings, the mean reverting process is present in KSE-100 and SSE-100 stock market returns, indicating that the stock prices revert to their historic rate after a certain time. Additionally, the slow mean reverting process and high volatility in both stock returns can be seen based on the large values of ARCH and GARCH coefficients. KSE-100 has a faster mean reversion process compared to the SSE-100 stock market (Table 4), but the comparative volatility is lower than the SE-100 stock market. Furthermore, the results of CGARCH (1,1) models are also presented in Table 4. All the parameters are significant for both stock market returns. Also, the results from the MRS model are shown in Table 5.
|
Mean |
Std. Dev. |
Skewness |
Kurtosis |
Jarque-Bera |
ARCH-LM |
|
|---|---|---|---|---|---|---|
|
DLKSE |
0.00021 |
0.01076 |
-0.637 |
7.813 |
1818.970 |
0.026* |
|
DLSSE |
0.00007 |
0.01676 |
-1.206 |
9.918 |
3934.076 |
1.323* |
*significant at a 5% level of significance
|
Stock Market |
KSE-100 |
SSE-100 |
||
|---|---|---|---|---|
|
|
Level |
1st Difference |
Level |
1st Difference |
|
Intercept |
-2.123 |
-37.1309* |
-2.13975 |
-38.934* |
|
Intercept and trend |
-2.108 |
-37.1238* |
-2.17522 |
-38.9561* |
*significant at 5% level of significance
|
Stock |
Models |
AIC |
BIC |
|---|---|---|---|
|
KSE |
GARCH (1,1) |
-6.43261 |
-6.42017 |
|
CGARCH (1,1) |
-6.43205 |
-6.4134 |
|
|
MRS |
-6.27541 |
-6.25364 |
|
|
SSE |
GARCH (1,1) |
-5.76645 |
-5.75401 |
|
CGARCH (1,1) |
-5.46456 |
-5.44589 |
|
|
MRS |
-5.58328 |
-5.56149 |
|
Stock Market |
KSE |
SSE |
KSE |
SSE |
|
|---|---|---|---|---|---|
|
Models |
GARCH (1,1) |
CGARCH (1,1) |
|||
|
Constant |
0.000709 |
0.000242 |
µ |
0.000693* |
0.000067* |
|
|
0.122135* |
0.05693* |
|
0.000121* |
0.000281* |
|
|
0.839204* |
0.932965* |
|
0.965384* |
0.96025* |
|
|
0.961339 |
0.989895 |
|
0.121141* |
0.12094* |
|
- |
- |
- |
|
0.029936* |
0.04000* |
|
- |
- |
- |
|
-0.71615* |
0.24716* |
*significant at a 5% level of significance
|
Regimes |
KSE-100 |
SSE-100 |
|
|---|---|---|---|
|
1 |
Const |
-0.00273 |
-0.06319 |
|
AR(1) |
0.72119* |
0.076395* |
|
|
2 |
Const |
0.0013 |
0.00169 |
|
AR(1) |
-0.07029* |
0.078525* |
|
|
|
LOG(SIGMA) |
-4.62247* |
-4.31411* |
*significant at 5% level of significance
|
SSE-100 |
||||
|---|---|---|---|---|
|
Forecast Model |
RMSE |
MAE |
MAPE |
SMAPE |
|
GARCH (1,1) |
76.5379 |
57.7408 |
0.7496 |
0.7497 |
|
CGARCH (1,1) |
76.4960 |
57.7244 |
0.7495 |
0.7495 |
|
MRS |
76.5911 |
58.4343 |
0.7587 |
0.7588 |
|
LSTM |
76.4510 |
58.0807 |
0.7543 |
0.7536 |
|
KSE-100 |
||||
|
Forecast Model |
RMSE |
MAE |
MAPE |
SMAPE |
|
GARCH (1,1) |
402.7442 |
291.7269 |
0.6370 |
0.6363 |
|
CGARCH (1,1) |
402.7384 |
291.7168 |
0.6370 |
0.6363 |
|
REGIME |
406.2231 |
290.5655 |
0.6350 |
0.6347 |
|
LSTM |
403.3712 |
294.1198 |
0.6417 |
0.6417 |
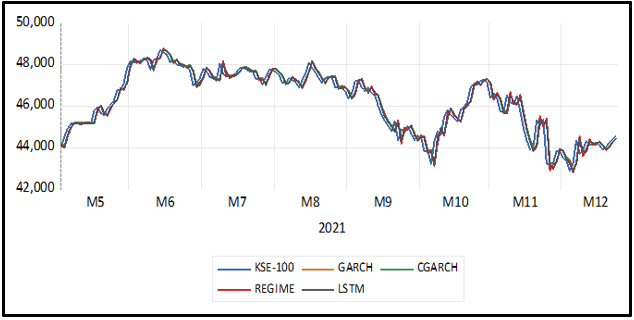
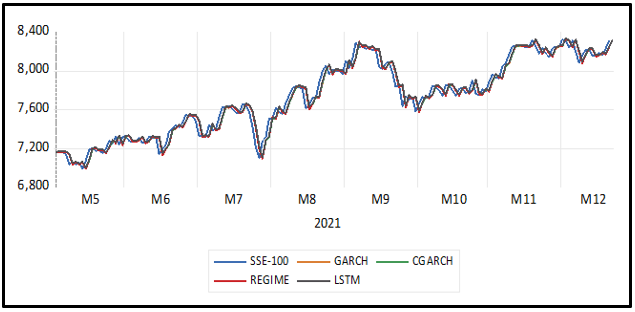
According to Table 6, the component GARCH model outperforms other models, i.e., GARCH (1,1), MRS, and machine learning LSTM model, based on three forecast evaluation criteria, namely MAE, MAPE, and SMAPE for stock returns of SSE-100. But according to the RMSE, the machine learning LSTM model is the best forecast model compared to GARCH models and the nonlinear Markov regime-switching MRS model. The CGARCH (1,1) forecast performance dominates other models and can be used for SSE-100 as an alternative compared to other time series and ML techniques. Similarly, mixed results are found for the KSE-100 stock returns. The predictive power of CGARCH (1,1) outperforms other time series and machine learning models based only on RMSE. The remaining forecast evaluation criteria, namely MAE, MAPE, and SMAPE results, support the nonlinear threshold MRS model. The predictive power of the MRS model is most suitable and reliable for KSE-100 compared to other techniques in this study. The graphical presentation of the forecast performance of GARCH (1,1), CGARCH (1,1), MRS, and LSTM model can be seen in Figure 5 and Figure 6 Both forecast performance graphs show that all the models are suitable for forecasting the stock market returns of KSE-1000 and SSE-100.
CONCLUSION
China Pakistan economic corridor (CPEC) is one of the best projects of one belt one road, i.e., OBOR. OBOR is an economic strategy by China and Pakistan to connect nations from Asia to Europe. The stock markets of Pakistan, i.e., KSE-100, and China, i.e., SSE-100, have been the centre of attraction for the global economies since 2015. Volatility modeling and forecasting are crucial for national and international economists, investors, and policy-makers. In this study, the forecast performance of three different techniques is compared. GARCH family models, namely tridiagonal standard GARCH and component GARCH (CGARCH) models, nonlinear Markov-regime-switching (MRS) model, and machine learning long-short term memory (LSTM) model. The daily closing price of stock markets related to pioneers of CPEC, namely KSE-100 and SSE-100 stock markets data, are selected, including the period of the COVID-19 pandemic from December 2014 to December 2021. KSE-100 and SSE-100 stock market returns show long and flatter left-side tails, i.e., leptokurtic. The stock returns are generally not distributed Based on the Jarque-Bera test. This evidence concludes that the CPEC stock markets are efficient but unpredictable, and a high probability of earning is expected. Furthermore, GARCH (1,1) model parameters are highly significant. It is also revealed that the stock prices revert to the historic rate after a specific period.
KSE-100 has a faster mean reversion process and lower comparative volatility than the SSE-100 stock market. In comparing the forecast ability, the forecast performance of the CGARCH (1,1) model outperforms traditional standard GARCH (1,1), MRS, and LSTM models for the SSE-100 stock market returns based on MAE, MAPE, and SMAPE forecast evaluation criteria. While based on RMSE forecast criteria, the forecast performance of the machine learning LSTM model is found to be better. Furthermore, the forecast performance of the nonlinear MRS model outperforms GARCH models based on MAE, MAPE, and SMAPE. In contrast, the CGARCH (1,1) model is the best forecast model based on RMSE for KSE-100 stock market returns. Overall, the forecast performance of the machine learning LSTM model is very close for both the stock markets, i.e., KSE-100 and SSE-100 stock markets.
It is suggested to use the machine learning LSTM and nonlinear MRS models to forecast stock market volatility, especially for CPEC initiators, i.e., Pakistan and China. This study will be helpful for economists and investors as they can use the LSTM and MRS models as an alternative to GARCH models for accurate stock returns forecast, especially during rare events, i.e., the COVID-19 pandemic. This study has limitations related to two stock markets only related to CPEC. More stock markets can be used to explore the stock market volatility and evaluate the forecast performance of studied models in this paper. Future studies can explore more stock market indices and compare the forecast performance of other linear, nonlinear, GARCH, and ML models with the traditional GARCH models included in this study.